
The most recent 2025 financial statements from Canada’s largest upstream oil and gas companies continue to show alarming asset retirement obligation (ARO) accounting practices that amount to material underreporting of this major balance sheet liability.
FY2024 vs. FY2025
Our 2026 AGM Escalation Plans
The Accounting Issue Explained
Why This Matters
COMPARISON TABLE: FY2025 vs. FY2024.
FY2024 vs. FY2025
Overall, across the 13 companies reviewed (see comparison table below), we see no meaningful improvements in the discount rates used. Half are still using relatively high credit-adjusted discount rates. Notably the distortion is concentrated in the companies with the greatest decommissioning liability exposure (Suncor $12.6B, Canadian Natural $9.7B, Cenovus $4.87B, Imperial $3.35B). This practice remains contested under international accounting standards (IAS 37), and the International Accounting Standards Board is actively considering an amendment that would explicitly require a risk-free discount rate for decommissioning liabilities.
Beyond basic sensitivity testing of the discount rate, we see no quantitative sensitivity analysis of the impacts of the accelerating energy transition on the assumptions used to calculate this key liability. Business-as-usual 50+ year asset lives remain status quo, with little risk analysis testing more realistic timelines. The way decommissioning liabilities appear on the balance sheet is extremely sensitive to discount rate and asset life assumptions. This makes it difficult for shareholders to accurately assess company value and balance sheet risk.
Three notable improvements show better accounting is possible. At Baytex, we see improved disclosure of asset life assumptions. Baytex discloses how the present value of decommissioning liabilities will be settled in 5-year increments over the next 52 years, versus only disclosing the assumed asset lives for FY2024. This is the most transparent disclosure of any of their Canadian peers.
At Tourmaline, Arc, and Peyto, management added a one percent discount rate sensitivity analysis to a non-credit-adjusted discount rate of 3.85% to 3.9%. Finally, we see Athabasca Oil providing a 5-year sensitivity analysis to its 50-year asset life projection. Although not equivalent to a realistic accelerating energy transition scenario, it is significant as Athabasca is the only one of its peers to show the quantitative impact of a reduction in this assumption. It is worth noting, however, that Athabasca continues to apply a 7-8% credit-adjusted discount rate — among the higher end of the peer group — which limits the overall quality of its ARO disclosure despite this improvement.
At the same time, the independent auditors persist in overlooking these issues as Critical Audit Matters, despite the materiality of these liabilities and the significant management judgement involved in calculating them. This is inconsistent with the applicable auditing standards which require auditors to highlight matters involving significant judgement that are most important to the financial statements.
This practice is also contrary to applicable accounting standards. The lack of disclosure and scrutiny persists despite clear guidance for applying the IFRS, stronger practices adopted by industry peers, and ongoing investor engagement on the issue. These issues were elaborated in our 2025 report
Our 2026 AGM Escalation Plans
As a result, we are escalating our engagement with certain companies — as we signalled we would in a series of January 2026 letters — by voting against the re-election of the Chair of their Audit Committee and the reappointment of their independent auditor.
At this stage, we are flagging Suncor Energy and Cenovus Energy, two of the largest upstream oil and gas companies in Canada. Both lack clarity in their asset life assumptions, use credit-adjusted discount rates, and fail to quantitatively assess the impact of the accelerating energy transition.
Imperial Oil, which also uses a credit-adjusted discount rate of 6% and provides no asset life disclosure or sensitivity analysis of any kind in either 2024 or 2025, remains under close review.
CNRL, despite the size of its decommissioning liabilities and failure to improve its associated accounting practices, was not targeted in this years’ AGM escalation because it released its audited financials latest of its peers (March 25, versus others released between February 19 and March 13), and as such was only just added to this analysis.
The Accounting Issue Explained
Decommissioning obligations in Canada’s upstream oil and gas sector are widely recognized as material liabilities. Even as currently reported, these obligations are equivalent to approximately 5% to 28% of shareholder equity among major companies, a huge stake running into the tens of billions (see table below).
These liabilities arise from the legal obligation to decommission oil sands mines, wells, pipelines, and other infrastructure at the end of their useful lives. Two key assumptions drive the reported present value of these liabilities, namely: the discount rates, which are applied across multi-decade asset lives.
Small changes in either assumption can dramatically alter the present value of the reported liability. In practice, this means that reported ARO balances can appear multiple times smaller than the underlying future obligation.
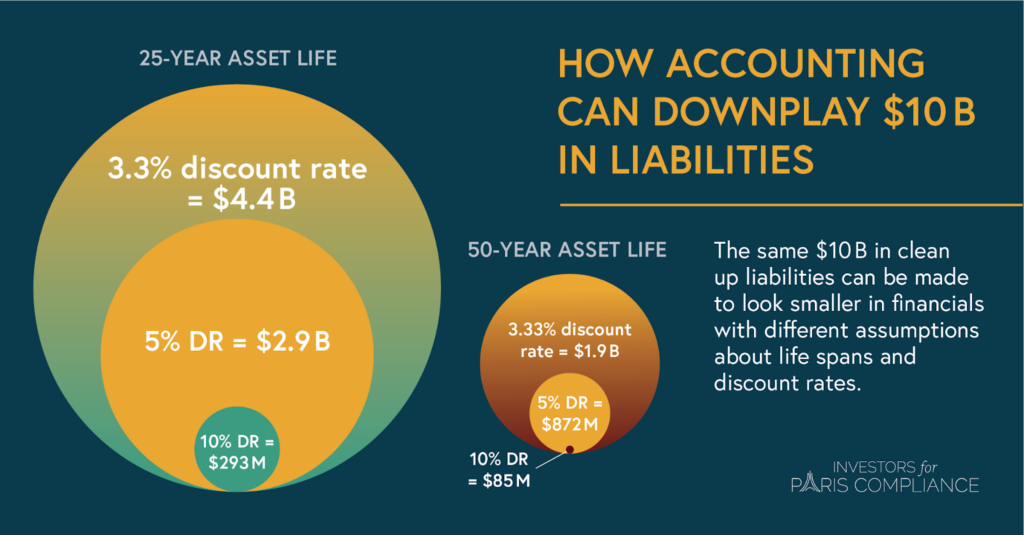
Note: This infographic illustrates how $10 billion in decommissioning liabilities can appear on a company’s balance sheet depending on discount rate and asset life assumptions applied (see Table 3 of our November 2025 report).
These concerns are heightened by broader uncertainty regarding the total scale of decommissioning liabilities in the sector even before accounting assumptions are applied. Estimates produced by the provincial regulator have been publicly questioned, including through investigations conducted by the Auditor General of Alberta. In spite of this, none of the assessed companies or their auditors identify the original ARO estimate as a major uncertainty.
Why This Matters
The combination of elevated discount rates and undisclosed or extended asset life assumptions means that reported ARO balances can appear a fraction of the liability that would be calculated under more realistic, standards-compliant assumptions — masking the true scale of future financial obligations and creating material risk for investors assessing company value and balance sheet resilience.
At a minimum, investors would benefit from:
- Disclosure of all key assumptions;
- Application of non-credit-adjusted discount rates; and
- Disclosure of sensitivity analysis for key assumptions, including
- a one percent change on a non-credit-adjusted discount rate, and
- asset life scenarios that align with an increasing energy transition scenario.
Without more transparent and robust disclosure as well as stronger auditor scrutiny, investors cannot reliably assess the true scale of these long-term liabilities or their potential impact on company value.
| Company | Present value ARO | Ratio: ARO to SHE* | Asset life | Sensitivity analysis | Discount rate | Sensitivity analysis | ||||
|---|---|---|---|---|---|---|---|---|---|---|
| 2025 | 2024 | 2025 | 2024 | 2025 | 2024 | 2025 | 2024 | |||
| Canadian Natural Resources Ltd. | $9.74B total, est. $6.8B for Canada | 22% | 60 years | 60 years | None | None | 4.9% | 4.8% | +/- 1% | None |
| Cenovus Energy Inc. | $4.87 B | 15.4% | N.D. | N.D. | None | None | 5.5% | 5.2% | +/- 1% | +/- 1% |
| Suncor Energy Inc. | $12.6 B | 27.9% | Maj. w/in 40 years | +50 years | None | None | 5% | 4.8% | +/- 1% | +/- 1% |
| Paramount Resources Ltd. | $0.43 B | 15.7% | 51 years | 51 years | None | None | 7% | 7.0% | +/- 1% | None |
| Strathcona Resources Ltd. | $0.24 B | 5.5% | 58 years (maj. w/in 24 years) | 58 years | None | None | 10% | 10% | -1% | None |
| Tourmaline Oil Corp. | $0.84 B | 5.4% | 61 years | N.D. | None | None | 3.85% | 3.33% | +/- 1% | None |
| ARC Resources Ltd. | $0.49 B | 6% | 57 years (maj. 2050-70) | Evenly over 57 years | None | None | 3.9% | 3.3% | +/- 1% | None |
| Whitecap Resources Inc. | $1.43 B | 13% | Up to 54 years | 54 years | None | None | 3.9% | 3.3% | None | None |
| Imperial Oil Limited | $3.35 B | 15.1% | N.D. | N.D. | None | None | 6% | 6% | None | None |
| Tamarack Valley Energy Ltd. | $0.13 B | 7.3% | Maj. w/in 45 years | 40 years | None | None | 3.9% | 3.3% | None | None |
| Baytex Energy Corp. | $0.52 B | 21.9% | 52 years, in 5-year increments | 55 years | None | None | 3.9% | 3.3% | None | None |
| Athabasca Oil Corporation | $0.13 B | 6.7% | Up to 50 years | 50 years | 5 years | None | 7-8% | 7-8% | +/- 1% | +/- 1% |
| Peyto Exploration & Development Corp. | $0.31 B | 10.9% | 50 years, maj. 2042-2076 | 50 years, maj. 2045-2071 | None | None | 3.85% | 3.3% | +/- 1% | None |